To print: Click here or Select File and then Print from your browser's menu

Accessing Free and Low Cost Mapping Data on the Internet:

Part 1

by: Toby Jutras
URL: http://localhost/gotoPointA.jsp?dest=2_10jutr

During my tenure in various engineering offices in New England, paper USGS (United States Geological Survey) Maps were very commonly used.

Engineers determining watershed areas would outline them on the map, planners would evaluate preliminary designs based on the 10' contours, and drafters would digitize them for use as locus maps.

There were, and still are many uses for this valuable data today, but our engineering has drifted away from paper, and integrating this material is getting more difficult in our electronic world.

In this series we will explore the digital equivalent of a USGS 7.5' Quad Map. Many private and government entities now provide in excess of 7 terabytes of data on the Internet in the form of metadata and imagery. In this first installment we will look at what types of data are available, and where they can be obtained.

Types of Data Available

Directly Supported Formats
Autodesk® Land Desktop 2i is very well positioned to take advantage of the many data types that are available for free, or low cost on the Internet. Below is a table of data directly supported in Autodesk Land Desktop 2i.

Data Type Formats Supported
GIS Vector Data ESRI ArcInfo Coverage
ESRI ArcInfo Export File
ESRI Shapefile
MapInfo
Microstation DGN
Terrain Data Digital Elevation Models (DEMs)
Image Data BMP, CALS-1, FLIC™, Geospot, GeoTiff, GIF, IG4, IGS, JFIF, JPEG, PCX, PICT, PNG, RLC 1, RLC 2, TARGA, and TIF

Extending the Supported Formats with the SDTS Driver
As of January 2000, all government data that contains a spatial element must be published using the SDTS file format standards. Having this driver will ensure you can take advantage of the tremendous wealth of data available. It can be purchased at the Autodesk Store (www.autodesk.com/estore) for under $200.

Extending Imaging Capabilities with Autodesk CAD Overlay
Although Autodesk® Map and Autodesk Land Desktop provide direct support for working with imagery, they may not provide all of the tools necessary to work with aerial photo data.

Two important features of Autodesk® CAD Overlay® are support for georeferenced wavelet format files, such as LizardTech's MrSID, and ER Mapper's ECW formats, and coordinate transformation support. MrSID and ECW are important formats to consider because many GIS organizations have standardized on these formats in order to take advantage of the powerful compression technology that they provide.

Coordinate transformation capabilities are important when compositing maps from different data sources.

For instance, if you find orthophotos that were provided in NAD83, but your current project references NAD27, CAD Overlay can automatically transform the image to its proper location based on the coordinate system defined in the AutoCAD Map or AutoCAD Land Development Desktop drawing.

There are many more advantages to using CAD Overlay. Use the chart below to help in deciding if CAD Overlay will be important in working with aerial photos.

Keep in mind that there are many other benefits to working with CAD Overlay, such as digitizing tools, and a variety of image adjustment tools.

Feature CAD Overlay AutoCAD Map AutoCAD
Raster Support Y Y Y
Geo Referenced Raster Support Y Y
Insert Raster from URL Y * *
Read/Insert Georef MrSID and ECW Y
Coordinate Transformation Y
Insert Raster from URL with Correlation Y
Edit/Save/Convert Y
Rubbersheeting Y

* Although URLs are supported, there is no user interface. The URL must be typed into the filename field of the insert dialog box.

Where to Find Data

Remember the old adage, "You get what you pay for"?

That isn't entirely so any longer. Many federal agencies and private organizations are providing data for free these days, and you only need to know where to find it to take advantage of these incredible offers.

National Data Sources

There is a vast amount of data available on the Internet. Federal government agencies such as the USGS, Census Bureau, and the Federal Geographic Data Committee provide access to metadata, and control the standards in which they are distributed. In most cases, these agencies provide valuable vector data, such as roadway networks and watershed data as well as aerial photography and scanned paper maps. Some state agencies have followed suit, and some of their local GIS data is available for download or for on a low-cost CD-ROM.

For years, data from agencies such as the USGS was hard to come by. Data needed to be ordered from a catalog, and it was shipped on media that often couldn't be used on PCs, and was in a format that not all software was capable of taking advantage of. As a result, this 'public' data was often only usable when purchased from a third party that had undertaken the time and expense of conversions so that data could be useful.

With the advent of the Internet, things changed quickly. At most Web sites, data can now be searched and even previewed. The Federal Geographic Data Committee is largely responsible for the new unified file format that has relieved the burden of supporting many different standards. DLGs (Digital Line Graphs), DEMs (Digital Elevation Models), and even ESRI data are now provided in a new format known as SDTS (Spatial Data Transfer Standard).

When the SDTS Driver Extension is installed, AutoCAD Map 2000i or AutoCAD Land Development Desktop 2i can import any data in this powerful format.

Furthermore, DEM data, ESRI data, as well as DOQQs (Digital Ortho Quarter Quads - photos) can be inserted using standard functionality in those products.

In the table below is a collection of the more popular national data sources.

These sites offer a combination of vector based metadata, scanned maps, and aerial imagery.

Web Site Services Provided
Kodak Earth Imaging This site provides high resolution (down to 6 inches) digital orthophotos at low cost.
National Atlas of the USA Although the intent is to provide an interactive online atlas, all of the data layers have been made available to download. Most are either in ESRI SHP, or SDTS format.
USGS Geographic Data Download Download DEMs, and DLGs at various scales. Transportation, Political Boundaries, Hydrography, and Wetlands layers make up the majority of this site.
US Census Bureau Population related data, such as building permits, demographics, etc.
The GIS Data Depot One of the most complete free online data catalogs. Duplicates nearly everything available at the USGS Sites, and supplements it with downloadable DRGs (Digital Raster Graphics), and fee based downloads.
National Geodetic Survey (NGS) The NGS web site allows you to download datasheets for control points by PID, location, or even by quad sheet. Additionally, you can download a corresponding SDTS file that allows you to plot their locations in plan.
Aerial Images, Inc. - TerraServer This site provides a map-based navigation tool to locate high-altitude aerial photography. Excellent coverage, and quality photos can be downloaded for low cost.

State & University GIS Sites

Many states now have dedicated offices for maintaining and publishing GIS data.

In those states that don't, often large universities have taken on that role.

Regardless of who the provider is, the data is invaluable. Below is a list of institutions in the Northeast that are providing either portals, or actual data.

States in other parts of the country offer similar services.

Web Site Download
DOQs/ Photos
Download
Metadata
Online Catalog Comments
State of Maine Y Y Very limited downloadable data
State of NH GRANIT Y No downloadable data available
Vermont Geographic Information System Y Y Photos are available for purchaseExcellent collection of metadata
New York State GIS Clearinghouse Y Y Y Color orthophotos available statewide in MrSID formatExtensive collection of metadata
Massachusetts MassGIS Y Y Y Extensive collection of photography available in MrSID formatExtensive collection of metadata
Rhode Island Geographic Information System Y Y Y Dedicated interactive image serverNearly all metadata available for download
UCONN Map and Geographic Information Center Y Y Y Image data provided in ER Mapper (ECW) image serverHistorical maps & metadata download
Pennsylvania Spatial Data Access Y Y Y 1m resolution DOQs in TIFF formatVast collection of metadata
New Jersey Spatial Data Clearinghouse   Y Y DEP has larger selection of GIS dataData is available on a series of 3 CDs for a modest cost
University of Delaware Spatial Analysis Lab Y Y   3 series of aerial photographyLimited metadata availability
Maryland State Government Geographic Information Coordinating Committee     Y Interactive mapping toolsData available for purchase at more significant costs than other states
University of Virginia Geospatial & Statistical Data Center Y Y   University provides limited metadata
West Virginia GIS Technical Center Y Y Y DEP Site provides DOQs in MrSID format

Next time we'll look at how to acquire the data, and how to set up a new drawing.


With years of industry experience in New England engineering firms, working on such projects as bulk fuel storage facilities, highway improvement projects and retail/residential development, Toby has developed the skill upon which his presentations are now based. As an Applications Engineer focusing on Autodesk''s Land Development offerings, Toby continues to work with industry leaders to develop powerful presentations that enable engineering firms to capitalize on new technology.
To print: Click here or Select File and then Print from your browser's menu

Accessing Free and Low Cost Mapping Data on the Internet:

Part 2
by: Toby Jutras
URL: http://localhost/gotoPointA.jsp?dest=2_11jutr

Last month we explored the types of free and low-cost GIS data available online, and where they can be obtained.

Now we'll look at how to acquire that data, and how to set up a drawing for its use.

Acquiring the Data

The file sizes for much of the data provided at state, federal, and university websites can be very large.

For instance, the DOQs from Pennsylvania Spatial Data Access (Pennsylvania's Geospatial Data Clearinghouse) are 45MB each! DRGs can be as large as 8MB compressed, and the SDTS data layers can also be very large.

High-Bandwidth Internet Connections
Using low-cost DSL or cable modem Internet connections is the preferred means for downloading geospatial data. If these services are not available to you, consider contacting local hotels and business centers, as many of them do provide this type of access. Be sure to inquire about the system requirements prior to arriving, and be sure to have plenty of drive space available to store these materials.

Decompressing the Data
Much of the data that you will download will be compressed. Most of it will be "zipped" but some data may be stored in a TAR file.

TAR (Tape ARchive) and GZ (gzip) files are often found on Unix-based Internet sites.

The TAR format does not provide compression; it is used only to group files.

GZ files cannot contain multiple files.

TAR files are compressed in the gzip format.


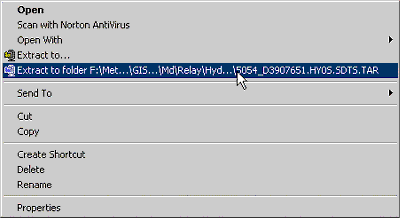
Figure 1: Use WinZip to extract files from an archive.

You can use WinZip to automatically extract files from an archive and decompress them to a folder on your system with the name of the original file (see Figure 1). This can be tremendously helpful because it eliminates what would otherwise be a multistep process.

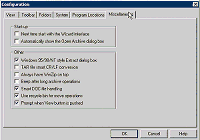
One note of caution: WinZip provides an option called "TAR file smart CR/LF conversion" that is enabled by default. You should disable this option prior to extracting the data. Otherwise, SDTS data files will not import correctly.

To disable this feature in WinZip:

  1. Start WinZip.
  2. Select Options > Configuration, which opens the Configuration dialog box (see Figure 2).
  3. Select the Miscellaneous tab.
  4. Clear the TAR file smart CR/LF conversion check box.
  5. Click OK to save the change.


Figure 2: Select the Miscellaneous tab, and clear the TAR file smart CR/LF conversion check box. (click image to enlarge)

Setting Up a New Drawing

Now that you've saved the data, you're ready to import it.

It's critical when you are importing metadata into a drawing that the drawing has a properly defined coordinate system.

Unlike AutoCAD® software, Autodesk® Map and Autodesk® Land Desktop are coordinate-system aware.

This means that when data is queried across drawings, imported using one of the import/export formats, or imported using CAD Overlay® software, that data is processed through a transformation engine.

If the imported data is in a coordinate system that is different from that of the drawing, the data is automatically transformed and placed in the correct location.

Keep this in mind as you begin to collect data and carefully note any information about the data's original coordinate systems for future reference.

Creating a New Drawing
Let's assume that you have already created a project and that it has no coordinate-specific settings. To create a project definition:

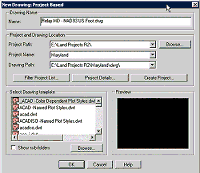
1. From the main menu, select File > New, which opens the New Drawing: Project Based dialog box (see Figure 3).

2. Enter the name of the new drawing. Try to be descriptive in the naming of your new drawing.

3. Select OK, which opens the Load Settings pane of the drawing setup wizard.


Figure 3: Enter the name of the new drawing in the New Drawing: Project Based dialog box. (click image to enlarge)

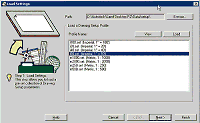
4. You can load predefined settings on the Load Settings pane of the drawing setup wizard (see Figure 4). If you will be repeatedly working at a specific scale, in the same coordinate system, it may be worth the few minutes that it takes to set up a Settings profile. That profile will enable you to set up future drawings with similar settings with a single click.


Figure 4: Loading a Settings profile.
(click image to enlarge)

5. In the Load Settings pane, select Next, which opens the Units pane.

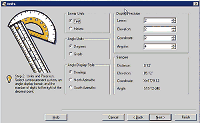
6. Select the desired unit and precision information from the list in the Units pane (see Figure 5). Keep in mind that the units you select in the drawing should be consistent with the coordinate system you plan on selecting. That is, ensure that you select feet as the units if you plan on using NAD83 US Foot.


Figure 5: Select the desired unit and precision information from the list in the Units pane. (click image to enlarge)

7. In the Units pane, select Next, which opens the Drawing Scale pane.

8. Enter the desired drawing scale. This setting will affect features such as annotation tools that use text.

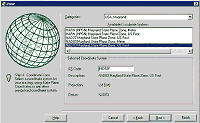
9. In the Drawing Scale pane, select Next, which opens the Zone dialog box (see Figure 6).


Figure 6: The Zone dialog box.
(click image to enlarge)

The Zone dialog box is the one we've been waiting for. In this dialog, we will select from the many available Zone Categories worldwide. In this example, we will be working with data from the state of Maryland, in NAD83, US Foot.

10. From the Categories drop-down menu in the Zone dialog box, select USA, Maryland.

11. In the Available Coordinate Systems box, select NAD83 Maryland State Plane Zone, US Foot. Notice the CS Code, description, projection, and datum summary information in the Selected Coordinate System pane.

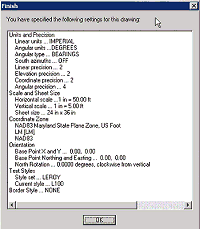
12. Click Finish. The Finish dialog box displays (see Figure 7). Check the settings once again, make any necessary changes, and then click OK.

Note: Although you do have other options available to you in creating a new drawing, they aren't relevant to this example, which is why we selected Finish.


Figure 7: Check the settings in the Finish dialog box.
(click image to enlarge)

Adjusting Settings in an Existing Drawing
In many cases, you may need to change the coordinate system during the evolution of a drawing. Any of the setup information can be accessed and modified after a drawing has been created.

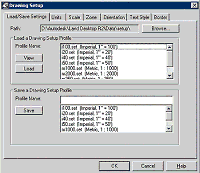
  1. From the main menu, select Projects > Drawing Setup. The Drawing Setup dialog box displays (see Figure 8).
  2. Select the appropriate tab.
  3. Make the appropriate changes.
  4. Click OK when you are finished.


Figure 8: After a drawing has been created, change setup information in the Drawing Setup dialog box. (click image to enlarge)

Conclusion
Next month we'll look at how to import some SDTS data for the USGS 7.5' Quad of Relay, MD.


With years of industry experience in New England engineering firms, working on such projects as bulk fuel storage facilities, highway improvement projects and retail/residential development, Toby has developed the skill upon which his presentations are now based. As an Applications Engineer focusing on Autodesk''s Land Development offerings, Toby continues to work with industry leaders to develop powerful presentations that enable engineering firms to capitalize on new technology.
To print: Click here or Select File and then Print from your browser's menu

Accessing Free and Low Cost Mapping Data on the Internet:

Part 3
by: Toby Jutras
URL: http://localhost/gotoPointA.jsp?dest=2_12jutr

In Part 1 and Part 2 of this series, we explored the various types of free and low-cost GIS data available online and learned how to set up an Autodesk® Map or Autodesk® Land Desktop drawing to use that data.

This month we'll learn how to import two of these data types—SDTS data files and NGS data sheets—into an established coordinate system.

Importing SDTS Data

Once you have a drawing with an established coordinate system, you can begin to import data. In this tutorial, we will begin by importing some SDTS data for the USGS 7.5' Quad of Relay, MD into Autodesk Map or Autodesk Land Desktop.

The first file we will be opening contains the definition of the political boundaries for the Relay, MD quad. The data was obtained from the GIS Data Depot.

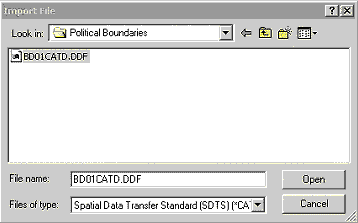
1. Open a drawing with an appropriate established coordinate system and select Map > Tools > Import. The Import File dialog box appears (see Figure 1).

2. Select SDTS as the data type to import from the drop-down list that appears.

3. Navigate to the folder where you have decompressed the data you want to import (see Figure 1). (In this example, the folder is called Political Boundaries.)

4. Select the STDS data file. (It will have the extension .ddf.)


Figure 1: Selecting the SDTS data file.

Note: Although we have referred to an SDTS "file," there are actually many files. The one displayed is the index file that contains references to each of the other accompanying data files.

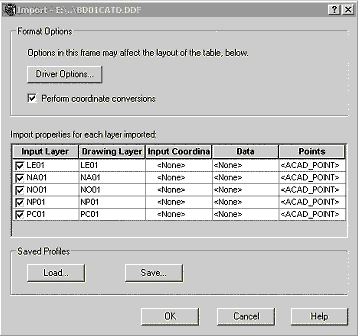
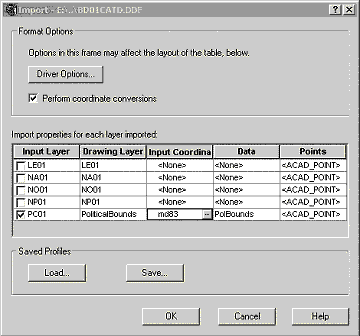
5. Select Open, which displays the Import options dialog box (see Figure 2).

You can perform a number of operations in this dialog box.

You'll choose the layers you want to import into the current drawing.

Many layers begin with the prefix N, L, or P, standing for nodes, lines, and polygons, respectively. Much of this data is redundant, so you will often limit the import just to the line or polygon layers, ignoring the node layers.

Sometimes, however, you'll want the node layers as well because you want the data attached to them—most typically when the nodes represent the centroid of a polygon.


Figure 2: SDTS Import options.

In this dialog box, you can also set the input coordinate system for each data layer (described a little further on).

Almost without exception, all layers should reflect the same coordinate system. Refer to any accompanying description of the data to determine what the input coordinate system should be. If a transformation is required during the import process, you can select the Perform coordinate conversions check box in the Format Options pane to carry it out.

Finally, SDTS data can store extended information about a vector object. You can import that data in the form of an Object Data Table into both Autodesk Map and Autodesk Land Desktop drawings.

To enable this, you would select on the data field for each layer, and select which data components that you would like to import.

If you are working with many data files of the same type, you can save these options in the Saved Profiles pane of the Import dialog box, and avoid having to reestablish these settings. Just save the settings to a profile and then load it before executing the import process.

6. Clear all check boxes in the Import Layer column except those beginning with the letter P (see Figure 3).

7. Set the layer name to import the object to (PoliticalBounds).

8. Click on the Input Coordinate field for this layer.

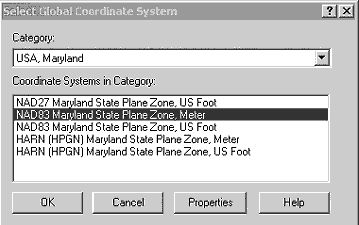
9. Select the small button with the ellipses (...), which opens the Select Global Coordinate System dialog box (see Figure 4).


Figure 3: Applying layer and coordinate settings.

10. Select the appropriate coordinate system from the provided options.

11. Select the Perform coordinate conversions check box.


Figure 4: Selecting the appropriate coordinate system.

Note: Even though our drawing is set up for US Foot, the data we're importing originated in Metric. Because we have enabled the coordinate conversions option, the data is automatically transformed during the import process.

12. Click OK to exit the Select Global Coordinate System dialog box.

13. To save the settings as a profile, click on the Save… button in the Saved Profiles pane.

By saving the profile, you can replicate all of the settings the next time you import an SDTS data file that contains political boundaries; for example, for an adjacent quad or in another session.

14. Click OK in the Import dialog box to begin the import process.

15. Perform a ZOOM EXTENTS when the import process completes.

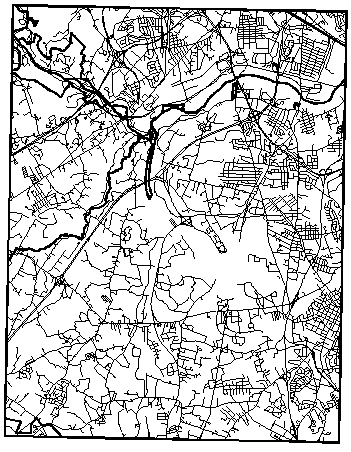
You should see the town and county boundaries for the quad you imported (see Figure 5). Repeat Steps 1-14 for each SDTS data layer you want to include in the completed map.


Figure 5: Political boundaries and roads after import.

The graphic in Figure 5 displays a combination of the town and county boundaries imported in the previous steps along with the transportation layers for that same quad. Additional layers could be added to represent watershed areas, horizontal and vertical control points, hydrography layers, and many more.

Importing NGS Data

For surveyors, tying a project to a known coordinate system has traditionally been a difficult process of recovering control points that were part of an NGS survey and incorporating them into the project.

Although the popularity of GPS has decreased the amount of effort required, you will still on occasion have to locate, recover, and incorporate these control points into your survey work.

Obtaining the NGS Data Sheets
The USGS and NOAA websites contain a vast amount of this sort of information, and you can easily become lost in looking for materials.

Note: For more information on how to obtain this data, see Part 1 of this series.


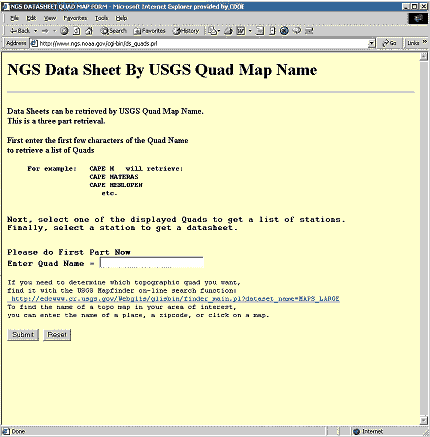
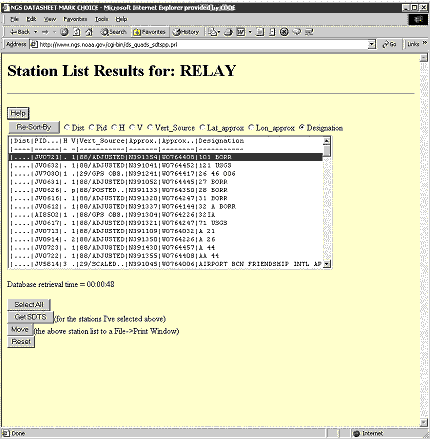
Figure 6: Downloading an NGS data sheet at the NGS website.

Using the tool provided at the NGS website, I found it easiest to download all of the control points for an entire quad (see Figure 6). That way you can more easily locate control points that are in the area of interest. The process doesn't take very long, and the results are great.

Viewing the NGS Data Sheets
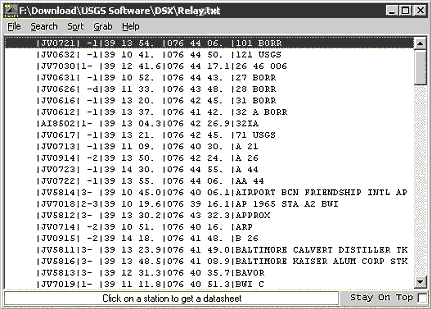
The NGS provides some freeware applications to view the data sheets you download in either an MS-DOS or Windows environment. You can download the Windows version from here.

Once the application is installed, start it up to view the NGS data you've downloaded. Here's how:

  1. Select the DSWin.exe application.
  2. Double-click the .exe file.
  3. Select File > Open.
  4. Select the data sheet you would like to open.

The individual data sheets within the file are then displayed in a list format (see Figure 7). You can sort by any of the columns or print the entire list.


Figure 7: A listing of NGS control points using the NGS data sheet viewer application (DSWin).

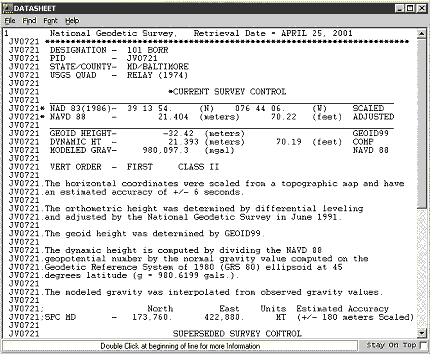
To view a specific control point, click on an item in the list as shown in Figure 7.


Figure 8: A sample NGS data sheet.

As I indicated earlier, you can also find an MS-DOS-based application—called DSX.exe—at the NSG website.

You can use this application to separate all data sheets into individual files if you choose, which is helpful if you plan to link the actual control points in the plan with the corresponding data sheets as we will be doing later on.

Obtaining NGS Vector Data

NGS also provides the SDTS files for control points, so you can incorporate that vector data into your drawings and GIS solutions as well.

And remember that you can download an SDTS file that represents an entire collection of control points for a USGS quad sheet, or download control points individually (see Figure 9).


Figure 9: Downloading vector locations for NGS control points.

Importing the NGS Point Data (SDTS)

You can import SDTS point data as blocks, which means the attribute values can be automatically populated with data from the SDTS file. The process is quite simple, but the results are very powerful.

  1. Create a block using the appropriate symbol.
  2. Add attributes for each of the data elements you would like to incorporate.
  3. Define your block. (See Figure 10.)


Figure 10: Sample block used to mark NGS control point locations.

If you are unsure of the data elements that are available to you, you can import the data first as points with object data. Once completed, you can review the Object Data Tables to see which fields are available. Here's what to do in this instance:

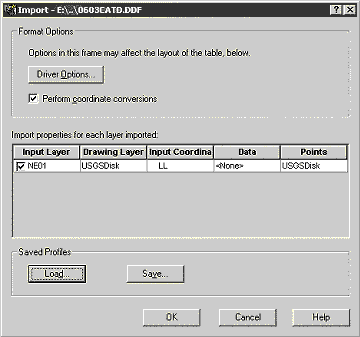
  1. Select Map > Tools > Import..., which the SDTS import dialog box.
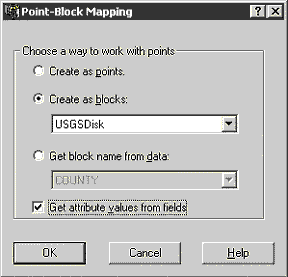
  2. Select the button in the Points field (click that cell once for the button to appear). (See Figure 11.) Once you've clicked the button, the Point-Block Mapping dialog box displays. (See Figure 12.)
  3. Select the Create as blocks check box.
  4. Select the appropriate block from the drop-down list below the check box.
  5. Select the Get attribute values from fields check box.
  6. Click OK.


Figure 11: Importing the NGS control points (Lat./Long. units).


Figure 12: Importing the NGS control as blocks instead of points.

Advanced Options
If you are planning to build a GIS from this data, it may be helpful to link the newly imported blocks to a database containing additional data about the control points or to the actual data sheet, which gives some narrative about the control, recovery, and other details.

Conclusion
Next month we'll learn how to import and digitize a third type of GIS data—the digital raster graphic (DRG)—for use in your drawings.


With years of industry experience in New England engineering firms, working on such projects as bulk fuel storage facilities, highway improvement projects and retail/residential development, Toby has developed the skill upon which his presentations are now based. As an Applications Engineer focusing on Autodesk''s Land Development offerings, Toby continues to work with industry leaders to develop powerful presentations that enable engineering firms to capitalize on new technology.